After you have found some active stocks, it’s time to start doing a little homework before taking a trade position. It starts with fundamentals (most of which is done during the screening process), then comes chart reading and your technical analysis. Candlestick charts will indicate whether a stock is bullish or bearish at a glance. You want to find a set-up on the chart, which will act as a timing trigger to take a trade position in the stock.
Beware of “Insider” Tips
Adding to part 3, and how to find active stocks, I’d like to share a piece of advice about paying others to find/provide you with stock market information. There are people who are called stock promoters, and there are individuals who are considered gurus in the game, and will provide their expert opinions or stock picks (usually for a price). I advise that you approach these people with extreme caution when it comes to looking for active stocks to trade, because most of these people are either:
· In the stock already and waiting for suckers to buy in and boost the price so they can sell their shares
· Getting paid by an interested 3rd party to promote their stock and may be creating fluff news for the stock to generate short term activity.
This is why it is important to know how to do your own research, and understand fundamental and technical analysis, because to base your trades on someone else’s advice from the market is not only lazy but very risky. I have used stock promoters or gurus to get trading ideas, but then I would take those stock ideas and add them to my own watch list and do my own research before jumping into action.
The Parts of the Chart
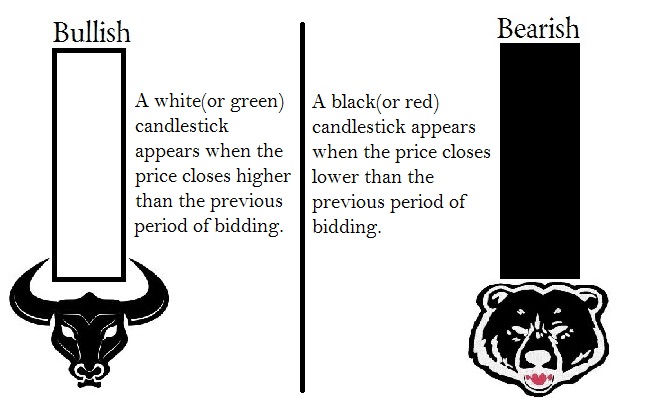
Technical analysis is a visual and mathematical way of calculating a risk and reward of a stock based on past trading activity. Here are the visual components of a candlestick chart:
Understanding what these candlesticks mean is to understand what it means when a stock is “Bullish” or “Bearish”. These candlesticks will give you an indication of the market involved with any particular stock, and if they are primarily buying or selling at a given time. These candlesticks will help you identify a developing trend, and give you a sign of when it would be a good time to get out of a trade. There are different periods of time you can view a stock’s chart. The charts vary from live intraday charts, day charts, week charts and higher. Depending on your trading style, you may primarily watch intraday charts, that may show a stock to be primarily bearish for the day, but switch to a weekly chart and now the same stock could be seen as primarily bullish for the week. This is why it is important to set goals and have a plan before you take your trade position. You should be searching for a set-up that meets your plan’s criteria, so that you have the best possible chance of reaching your investment goals.
How to Identify a Set-Up, Using a Stock Chart
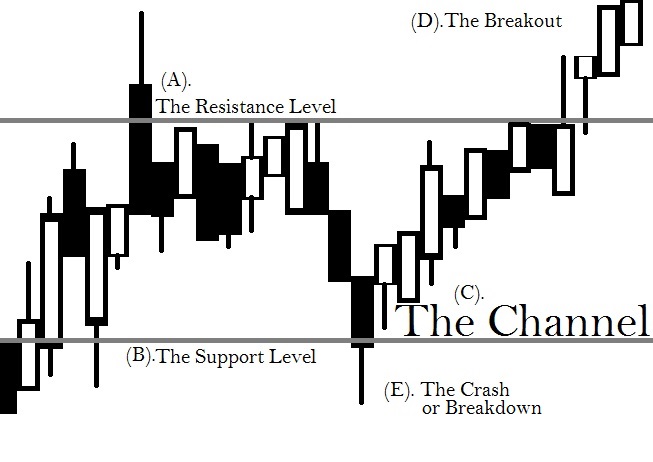
Whether you are buying or selling a position in a stock you are on the lookout for a set-up before you get involved in the market. A “set-up” is a collection of several indicators that help you decipher whether or not it is a good time to take your position in a stock. Here’s how a stock chart will indicate a set-up.
A). Resistance Level - When looking at a stock chart, this gray line will not appear, but this is something you must identify by looking at past trading action within a specific period of time (hour chart, day chart, week chart, etc.) This line is drawn in by you during your technical analysis, to show a trending price ceiling that has been acting as a signal for stock investors to become bearish and sell their shares.
B). Support Level - This gray line is the opposite of the resistance level. This is a trending price foundation that has been triggering a bullish reversal that pushes the price back up, due to an increased amount of investors buying a higher volume of shares.
C). The Channel - This is the price action sandwiched between a trending high/low spread that’s defined by support and resistance. You want to stay away from taking any positions while the stock price is maintaining respect to the boundaries created by support and resistance level. A channel occurs when a stock is either inactive with little price action, or the market is undecided as to whether investors want to hold or sell their shares. Investors could be waiting for a catalyst to push them one way or the other, like a report of quarterly earnings, fluff news, etc. This makes taking a position within the channel more of an unpredictable gamble, than a speculative decision based on calculated risk.
D). The Breakout - This occurs when the stock price gains bullish momentum and breaks above a prior resistance level. When this occurs there is a strong possibility that the stock is about to start trending, and may serve as an indication that it’s a good time to buy shares for the stock before the stampede of bulls drive the price to new highs.
E). The Breakdown (Crash) – This occurs when a stock’s price action falls below a support level. These tend to move with more momentum than the breakout, especially if a stock has shot into an upward trend in a short amount of time. This is why I like to “back test” my prospect stock’s price action, so that I may get a speculated “true value” or what I feel the bare minimum that stock is actually worth. I do this because if a stock has been getting a lot of attention in a short amount of time there is a good chance it will be short lived hype. If I miss the pump, and I miss the dump, I can wait for the market to correct back to the “true value” price or lower and then I can position myself for the price bounce scalp.


